Chapter 1 from Bjornstad (2018)
Libraries
library(epimdr)
Figure 1.2
data(ccs)
plot(ccs$size, ccs$ext*100, log = "x", xlab =
     "Community size", ylab = "Percent
     of time extinct")
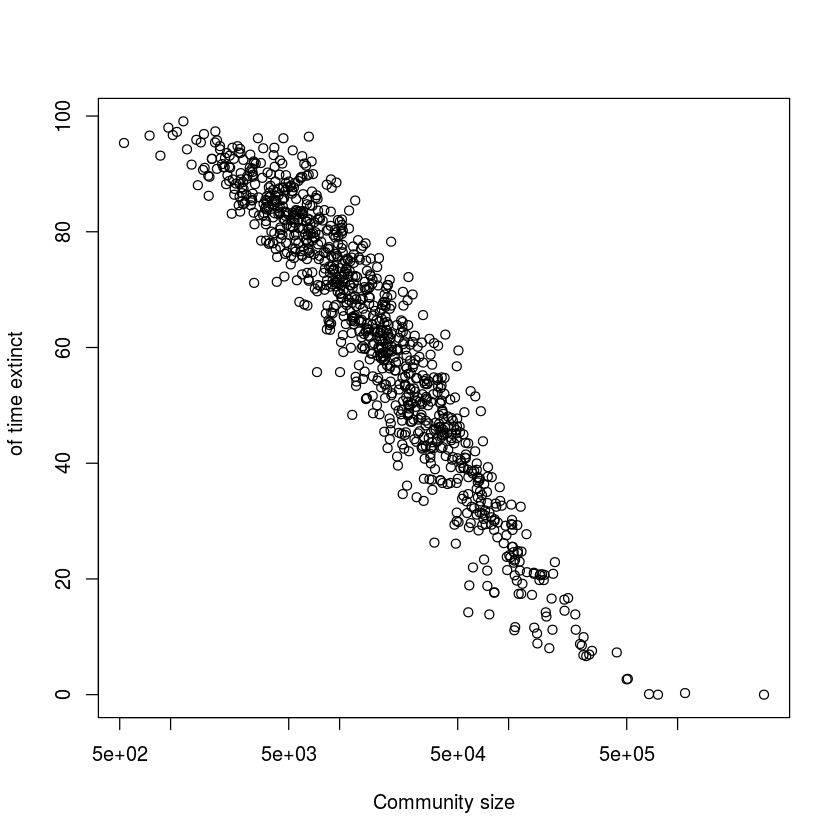
Fig 1.3a
plot(magono$time, magono$number, ylab = "Cases",
     xlab = "Year")
lines(lowess(x = magono$time, y = magono$number, f=.4))
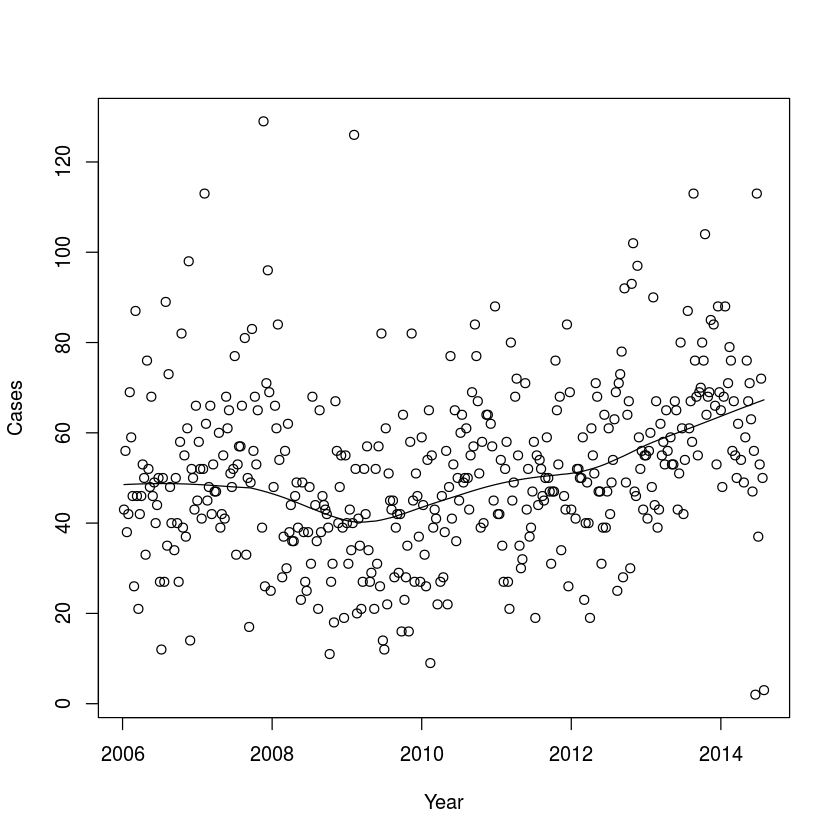
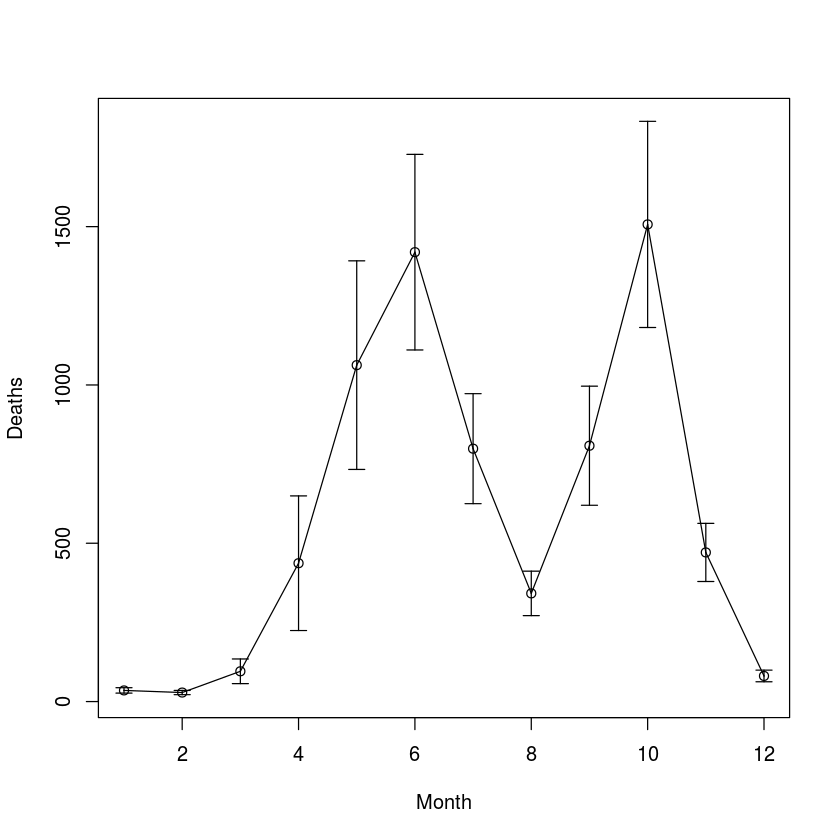
Fig 1.3b
data(cholera)
ses = sesdv = rep(NA, 12)
ses[c(7:12, 1:6)] = sapply(split(cholera$Dacca,
     cholera$Month), mean, na.rm = TRUE)
sesdv[c(7:12, 1:6)] = sapply(split(cholera$Dacca,
     cholera$Month), sd, na.rm = TRUE)/
     sqrt(length(split(cholera$Dacca, cholera$Month)))
require(plotrix)
plotCI(x = 1:12, y = ses, ui = ses+sesdv, li = ses-
     sesdv, xlab = "Month", ylab = "Deaths")
lines(x = 1:12, y = ses)