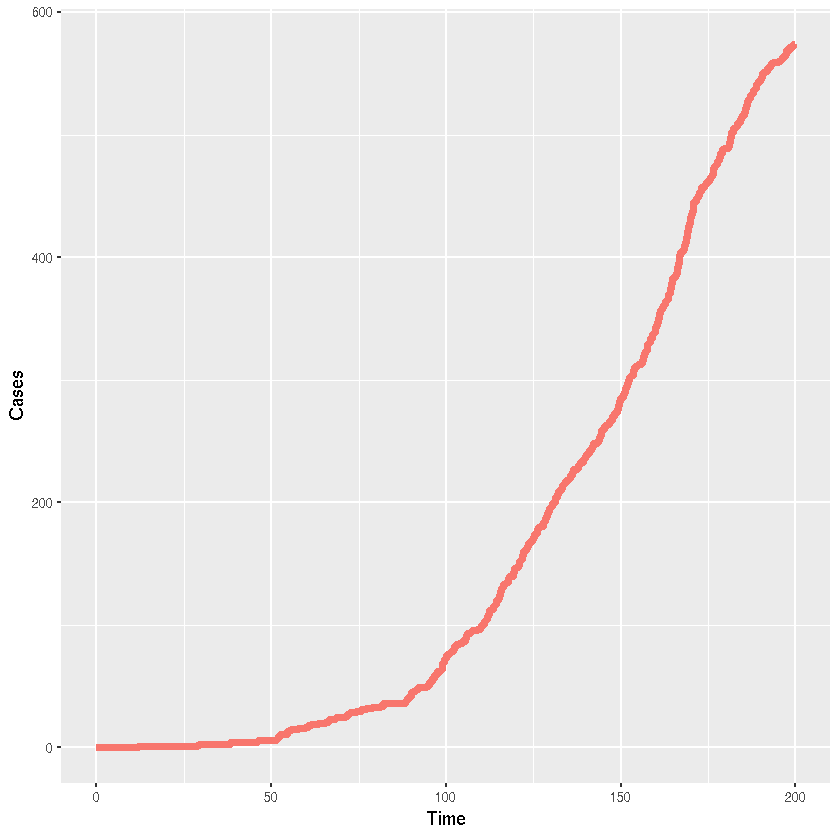
2001 records of 1 observables, recorded from t = 0 to 200
summary of data:
       Z
 Min.   :  0.0
 1st Qu.:  6.0
 Median : 73.0
 Mean   :163.3
 3rd Qu.:285.0
 Max.   :574.0
zero time, t0 = 0
process model simulator, rprocess = function (xstart, times, params, ..., zeronames = character(0),
    tcovar, covar, .getnativesymbolinfo = TRUE)
{
    tryCatch(.Call(euler_model_simulator, func = efun, xstart = xstart,
        times = times, params = params, deltat = object@delta.t,
        method = 0L, zeronames = zeronames, tcovar = tcovar,
        covar = covar, args = pairlist(...), gnsi = .getnativesymbolinfo),
        error = function(e) {
            stop(ep, conditionMessage(e), call. = FALSE)
        })
}
<environment: 0x55f3738>
process model density, dprocess = function (x, times, params, log = FALSE, ...)
stop(sQuote("dprocess"), " not specified", call. = FALSE)
<environment: 0x4afab20>
measurement model simulator, rmeasure = native function ‘__pomp_rmeasure’, defined by a Csnippet
measurement model density, dmeasure = not specified
prior simulator, rprior = not specified
prior density, dprior = native function ‘_pomp_default_dprior’, dynamically loaded from ‘pomp’
skeleton = not specified
initializer = function(params, t0, ...) {
    x0 <- c(S=999,I=1,R=0,Y=0)
    x0
  }
parameter transformation (to estimation scale) = not specified
parameter transformation (from estimation scale) = not specified
parameter(s):
  bet  gamm  iota     N
1e-01 5e-02 1e-02 1e+03